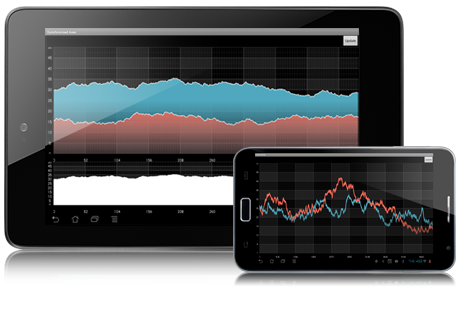
The best way to ensure that your control toolset is exactly what you need is to participate in its creation. That is how Iguana UI was born. A true Android Community Pack, Iguana UI is a set of free controls developed by Infragistics in conjunction with the Android developer community. The closed source library of high-end controls is designed and tuned specifically to the mobile Android platform.

With a "release early, release often" approach, Iguana UI's design and features are created and finessed based on direct feedback of the developer community. Benefits of Iguana UI include its familiar Android-like API, a tiny. jar to prevent executable bloat, and optimization of mobile's demanding, CPU, and battery usage criteria. Out of the gate, we're excited to introduce a powerful Data Chart, and will be adding more high-end controls with upcoming releases.
A version of the Infragistics' top performing Data Chart control has been redesigned from the ground up as part of the Infragistics Android Community Pack. This initial release covers the basic, 99% use cases and displays charts with hundreds of thousands of data points with real-time Motion Framework animated updates.


The Chart offers a simple, modular API designed specifically to allow easy access to the chart’s functionality. It offer built-in, natural multi-touch gestures for panning & zooming to drill-down to specific data points, or zoom out to see the big picture of your data.
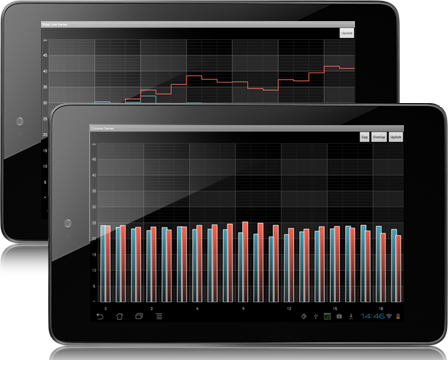
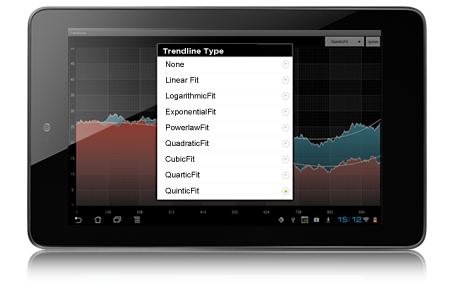
Your apps will benefit from the Chart's modularity. Multiple series are supported to create composite charts for better data comparisons. You can choose from Column, StepArea, StepLine, SplineArea series and more, while selecting from custom visual types such as solid, radial, and linear gradient fills. Place multiple X and Y axes on the same chart along the edges with axes that can be linear or logorithmic, offer full or partial auto-ranging, and present customizable labels as well as major and minor grid lines. And don't forget to add configurable trend lines - from linear fit to quintic fit, to exponential and power law fit - these types provide for clearer analysis.
