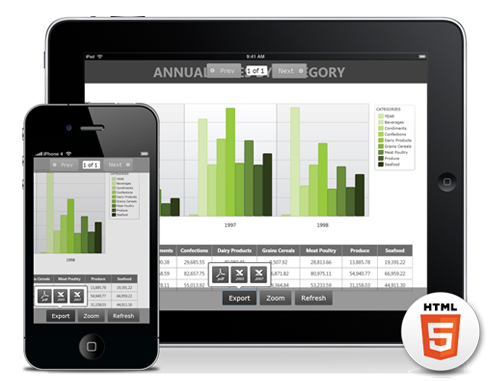
Now featuring HTML5 Report Viewers that support touch-devices, users can get actionable intelligence on the go using their iPad or iPhone.
Web, desktop, mobile – NetAdvantage Reporting does it all. Ensure your end-users can analyze key data within the same report from their desktop with the WPF or Windows Forms Viewer, on the web with the Silverlight Viewer, and on touch screen devices using the HTML5 Report Viewer.
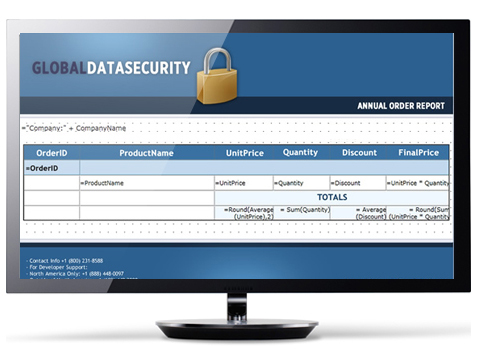
Build attractive reports to present your users key data efficiently and with minimum effort. Group data for additional meaning, filter items to take a deeper pe into report output, and define your own parameters to display exactly the info you need.
Design controls and features provide an easy way to create data reports. Since design controls are based in Visual Studio, all members of your team can work together building reports that optimize data presentation and visual appeal.
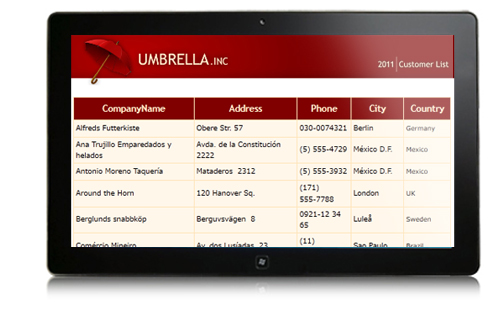
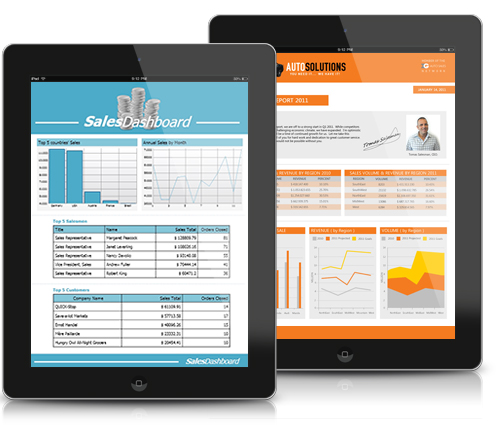
Give your report a dashboard look and feel with images, tables, labels, and charting capabilities that include area, column, line, and candlestick charts.
Get a rapid response and immediate support when you need it, 24 hours a day/5 days a week – via phone, email, or by chat. When you need to brainstorm, join our community of over 950,000 developers from the most popular software companies to the most data-demanding enterprises. You can also tap into our sample code, videos, and documentation to keep your project on - or ahead of - target.
